Climate Science
UPDATE April 2022 —Definitive answers to the big questions.
This short video is a great introduction to the causes driving climate change, and the effects on the earth that are resulting.
British climate scientist Ed Hawkins has developed a new set of climate visualizations, communicating the long term rise in temperatures for particular locations as a changing set of colors from blue to red.
In this image of global surface temperatures dark blue represents very cool and dark red represents very warm. Each stripe represents a year from 1850 to 2017. The difference between the coolest and warmest years is 2.43°F. The four warmest years are the last four.
 Annual global temperatures from 1850-2017
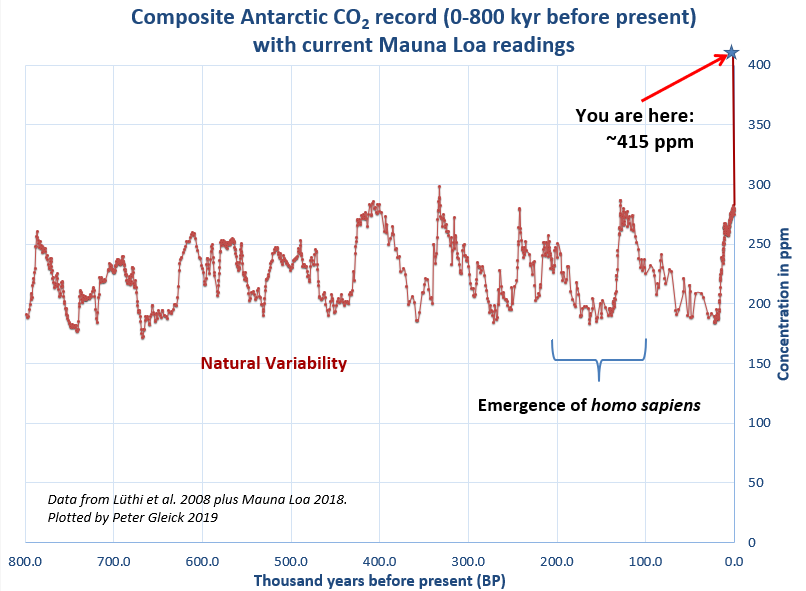
The concentration of CO2 in our atmosphere is now higher than at any time since humans have existed. Read the article
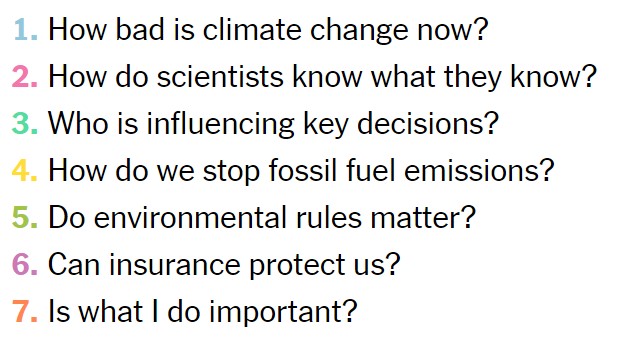
The science is clear: The world is warming dangerously, humans are the cause of it, and a failure to act today will deeply affect the future of the Earth. Click below for a seven-day New York Times crash course on climate change, in which reporters from the Times' Climate desk address the big questions:
We Are Already On Track To Catastrophic Warming
From the New York Times — 2019
The Earth has already warmed 1 degree Celsius (1.8 degrees Fahrenheit) since the 19th century. In October 2018, a major new United Nations report looked at the consequences of jumping to 1.5 or 2 degrees Celsius.
Half a degree may not sound like much. But even that much warming could expose tens of millions more people worldwide to life-threatening heat waves, water shortages and coastal flooding. Half a degree may mean the difference between a world with coral reefs and Arctic summer sea ice and a world without them.
According to the National Oceanic and Atmospheric Administration (NOAA ) September 2019 was the second warmest September on record for the US, but the warmest September on record for all of North America.
A Hotter Future Is Certain, Climate Panel Warns. But How Hot Is Up to Us. NY Times, August 2021.
Major Climate Report Describes a Strong Risk of Crisis as Early as 2040. NY Times, October 2018
Why Half a Degree of Global Warming Is a Big Deal. NY Times, October 2018
The Effects of Climate Change on Human Health
All the aspects of climate change will have direct or indirect effects on the health of humans and other living creatures. Some of these effects are easy to imagine, and some are less obvious. They will vary, of course, from region to region. A search for "impacts of climate change on health" yields many sites.One extremely thorough, well-organized and easy-to-understand survey, "The Impacts of Climate Change on Human Health in the United States: A Scientific Assessment" can be found here.
The Economic Impact of Climate Change
We hear about the impact of hurricanes, droughts and wildfires on the lives and places they destroy. But do we know the financial cost of these disasters?According to the Center for Climate and Energy Solutions (CCES):
- 2018: as of April 6 there have been three weather and climate disaster events with losses exceeding $1 billion each across the United States.
- 2017: the United States was struck by 16 climate and weather disasters. Each disaster cost at least a billion dollars in damage. The year 2017 now matches 2011 as having the greatest number of billion-dollar disasters. The CCES also reported that loses in 2017 exceeded $306.2 billion, compared to a $214.8 billion loss in 2005.
- 2012: Damage caused by Hurricane Sandy in 2012 cost $65.7 billion. The drought of 2012, the most extensive since the 1930's, affected almost half of the United States with an economic impact of $30.3 billion.
- 2005: the cost of Hurricane Katrina reached $148 billion.
The financial cost of climate-change disasters is another compelling reason to reduce our greenhouse gas emissions.
The Impact on the United States
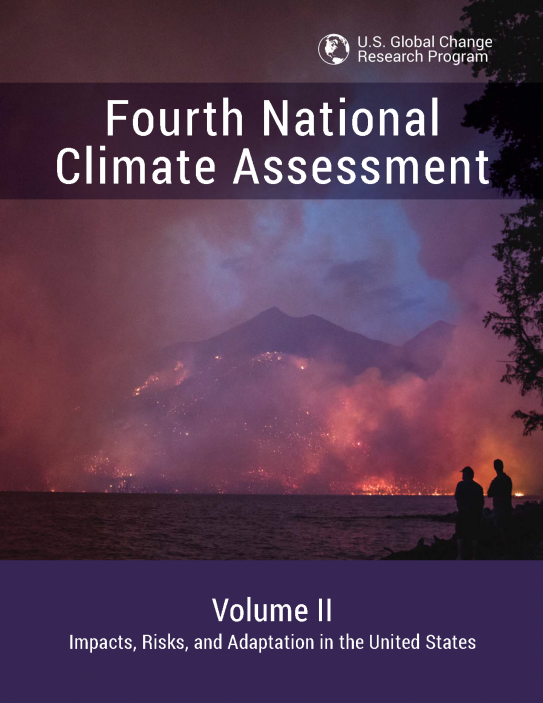 The Fourth National Climate Assessment (NCA4), completed in November 2018, is a comprehensive and authoritative report on climate change and its impacts in the United States.
Mandated by congress, this report is issued every 4 years and combines the research of 13 federal agencies.
The Impact on New York State
In 2015 carbon dioxide contributed 82% of the greenhouse gas emissions in the US.
According to studies presented by New York State Energy, Research and Development Authority (NYSERDA):
Changes have already been observed across the state. Here's what's predicted for the future:
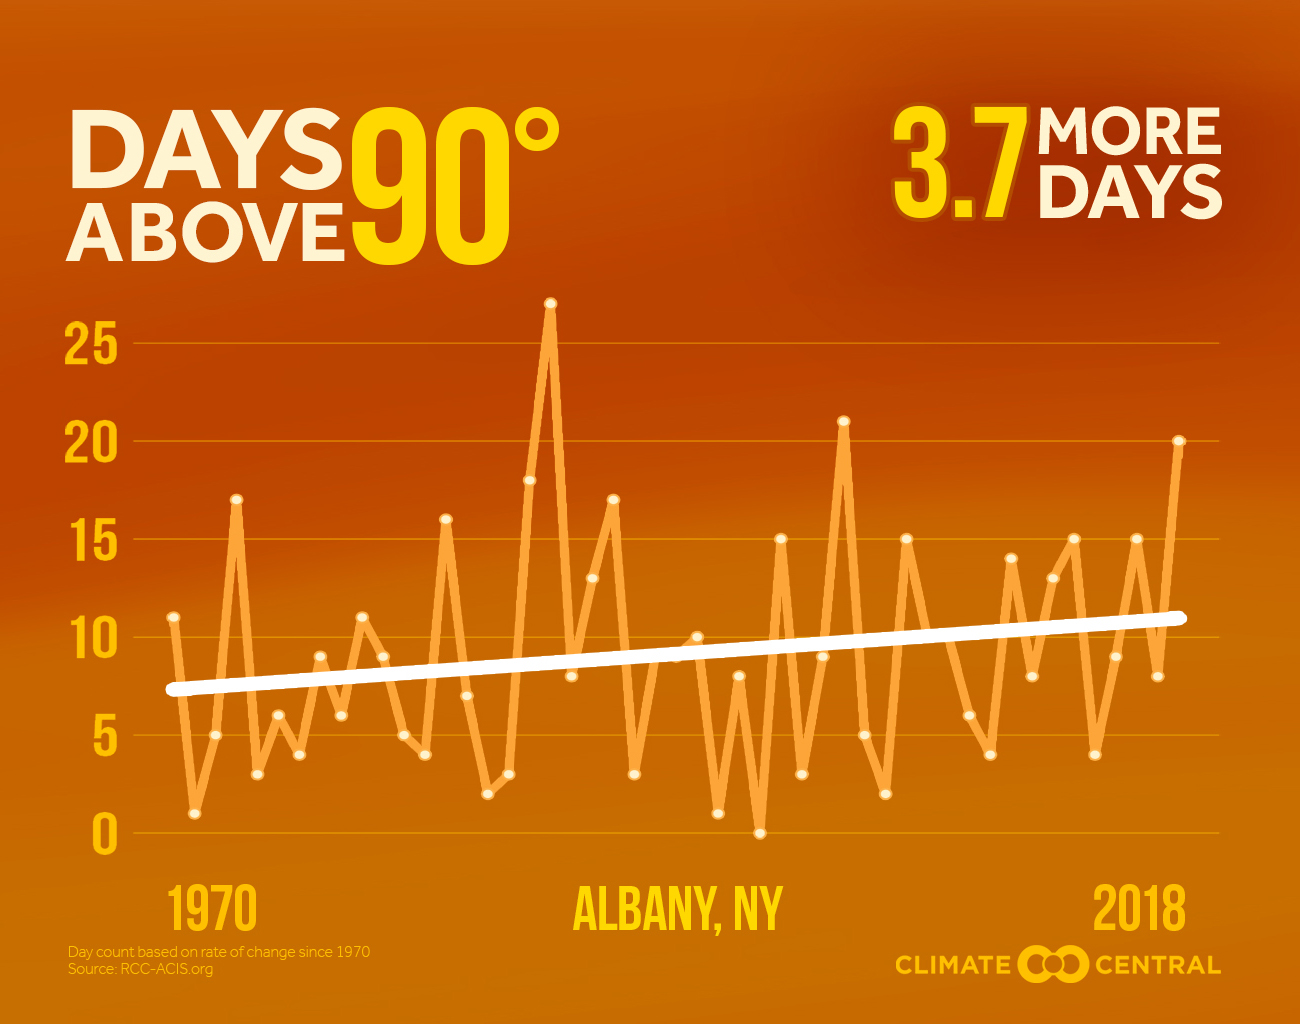
- An increase in the number and length of extreme heat events.
- More frequent short-term droughts.
- Increased frequency of extreme weather events.
- More intense downpours will most likely become more frequent.
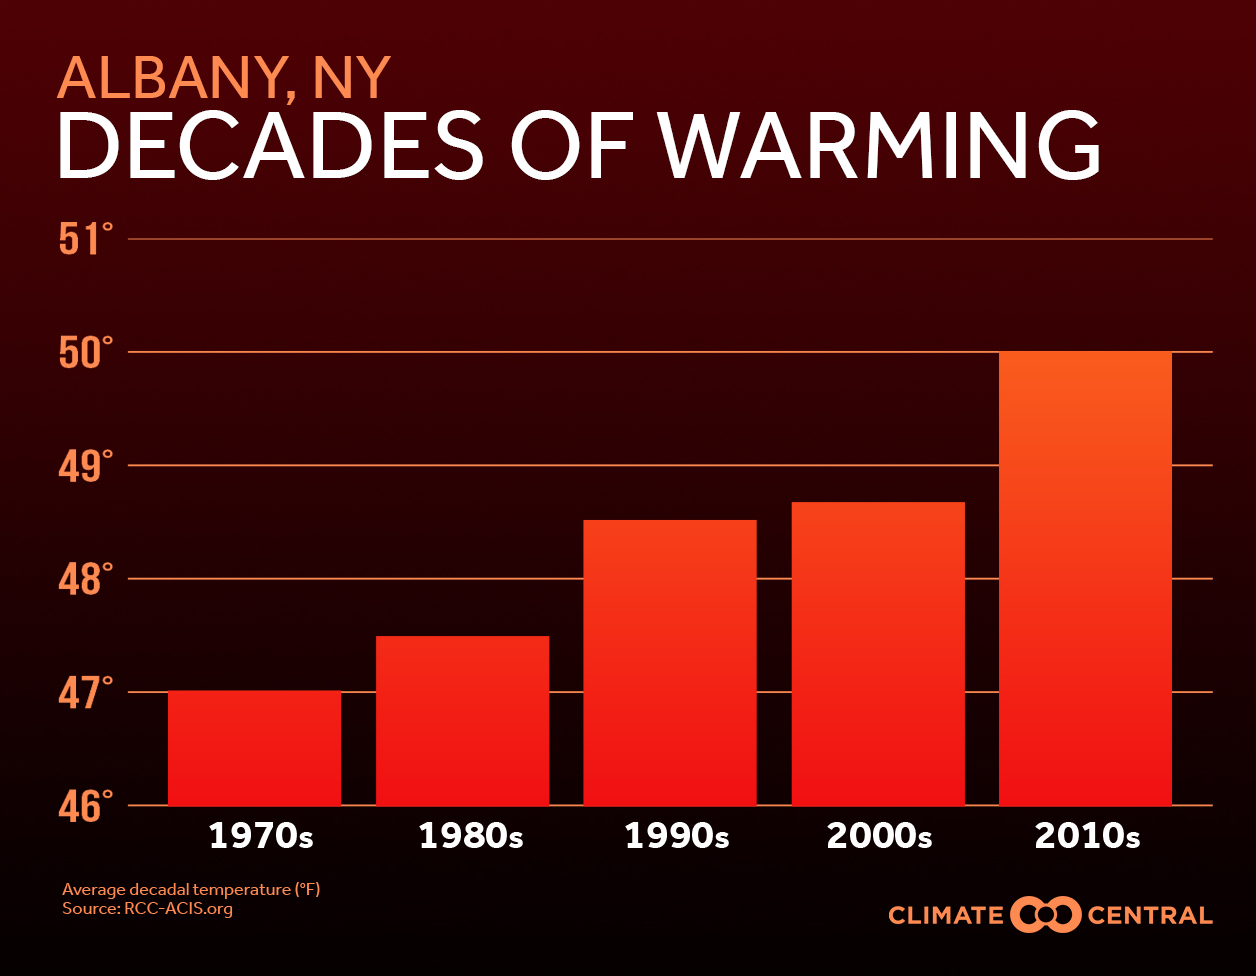
- Annual average temperature in New York State will rise.
- Climate projections for the Hudson Valley region through 2100.
Climate change is a threat not just in New York, but across our nation and around the world. The number of heat waves, major hurricanes and heavy downpours has increased, and the strength of these events has also increased according to the National Climate Assessment.
The Impact on Ulster County
A new tool from Cornell University allows us to see the history of climate change in Ulster County. The Cornell Climate Smart Farming (CSF) Program focused on developing agricultural decision support tools and resources to help farmers better manage the risks of climate change, and it can be used by the layman to determine climate change in local counties; go to www.climatesmartfarming.org.The CSF tool includes the following table on changes in temperature in Ulster County between 1950 and 2013:
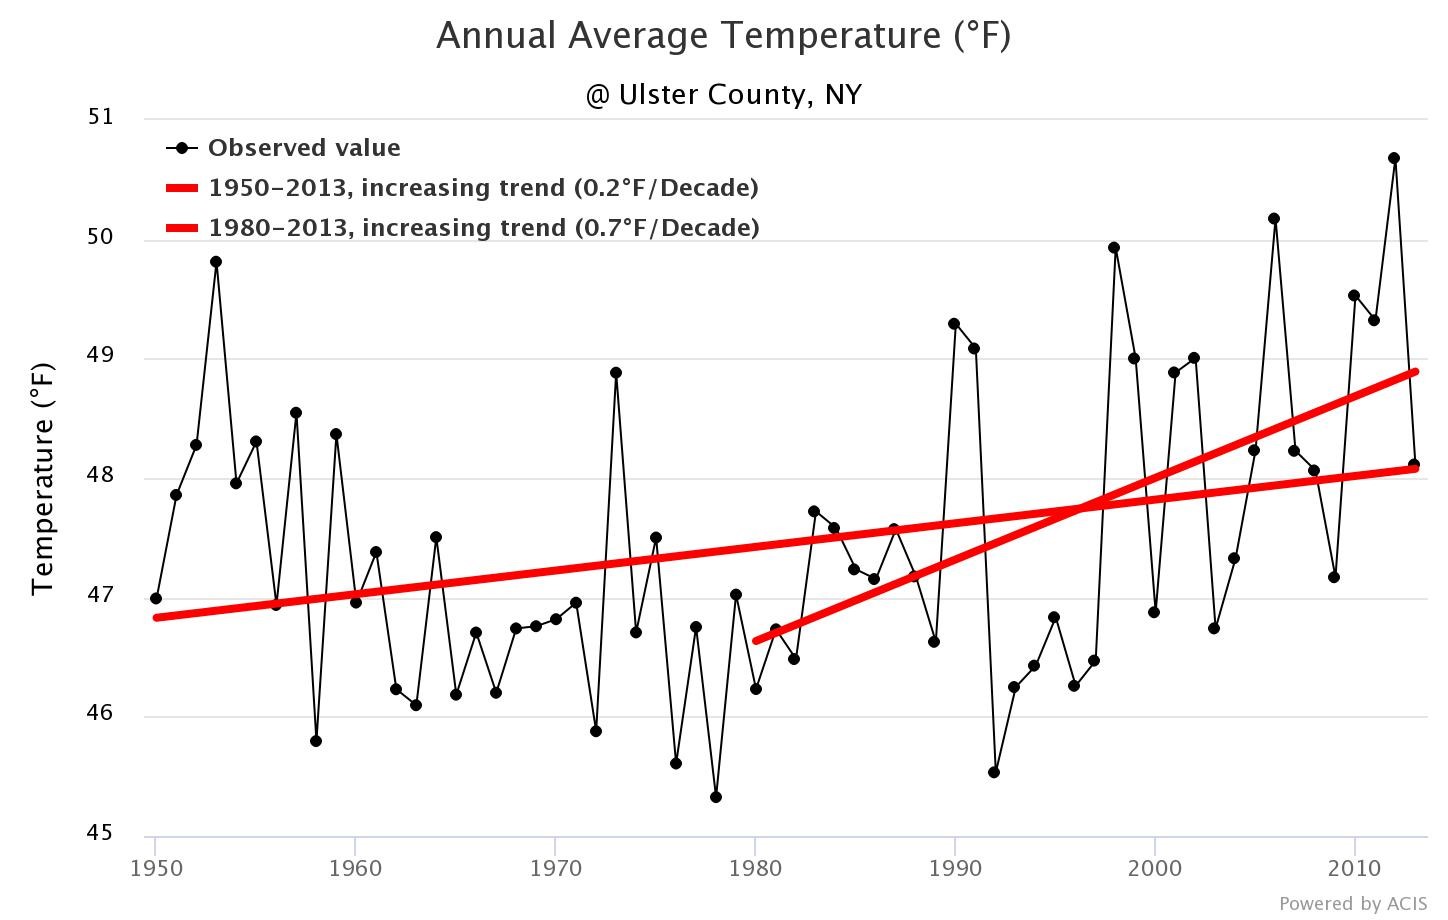
As the table shows, the temperature rose by 0.2 degrees Fahrenheit over 1950-2013, and changed dramatically starting in 1980, where the trend shows an 0.7 degree rise from then until 2013. The year 1989 is generally given as the time when scientists realized that the Earth's climate was changing dramatically because of man's impact on the environment.
In creating these tools, the CSF program collaborated closely with the Northeast Regional Climate Center (NRCC) at Cornell University, part of the RCC Program administered by NOAA in the United States. The tools rely on the NRCC-led data through the Applied Climate Information System (ACIS), which is an operational system that provides access to climate data and products to users via web services, and is replicated at multiple RCCs throughout the country. The CSF Tools also utilize daily temperature observations from the National Weather Service (NWS) Cooperative Observer Network, and daily precipitation derived from NWS radar data.
The Impact on Saugerties
 See details of how this is calculated.
NOAA projects a 67% risk of at least one flood over 6 ft taking place between today and 2050 in the Saugerties area, due to climate change. See an interactive map of the areas of projected Saugerties flooding